Accessing EtCO2 Trend
Data (continued)
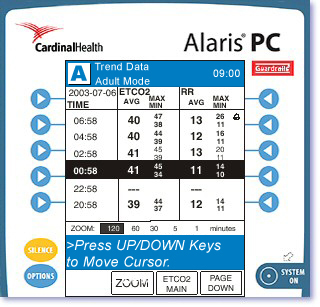
The following information appears on the EtCO2 Trend
Data display:
-
Time period for data collection
- Average EtCO2 with maximum (MAX) and minimum
(MIN) values
- Average RR with maximum (MAX) and minimum (MIN) values
- Alarm icon with “Fi” in the Time column to
indicate
high FiCO2 alarm limit violations
- Alarm icons indicating there were alarm violations with those
values
NOTE: If there is no data for the time period displayed, dashes (---)
will display.
|